
In the frenzied hours and days after a shooter opened fire and took the lives of nine people at the Emanuel African Methodist Episcopal Church in Charleston, law enforcement gathered at the Municipal Emergency Operations Center. The FBI, Charleston Police Department, state Highway Patrol and State Law Enforcement Division were all on the scene. To coordinate and provide situational awareness for all of the responders, city officials used their geographic information system.
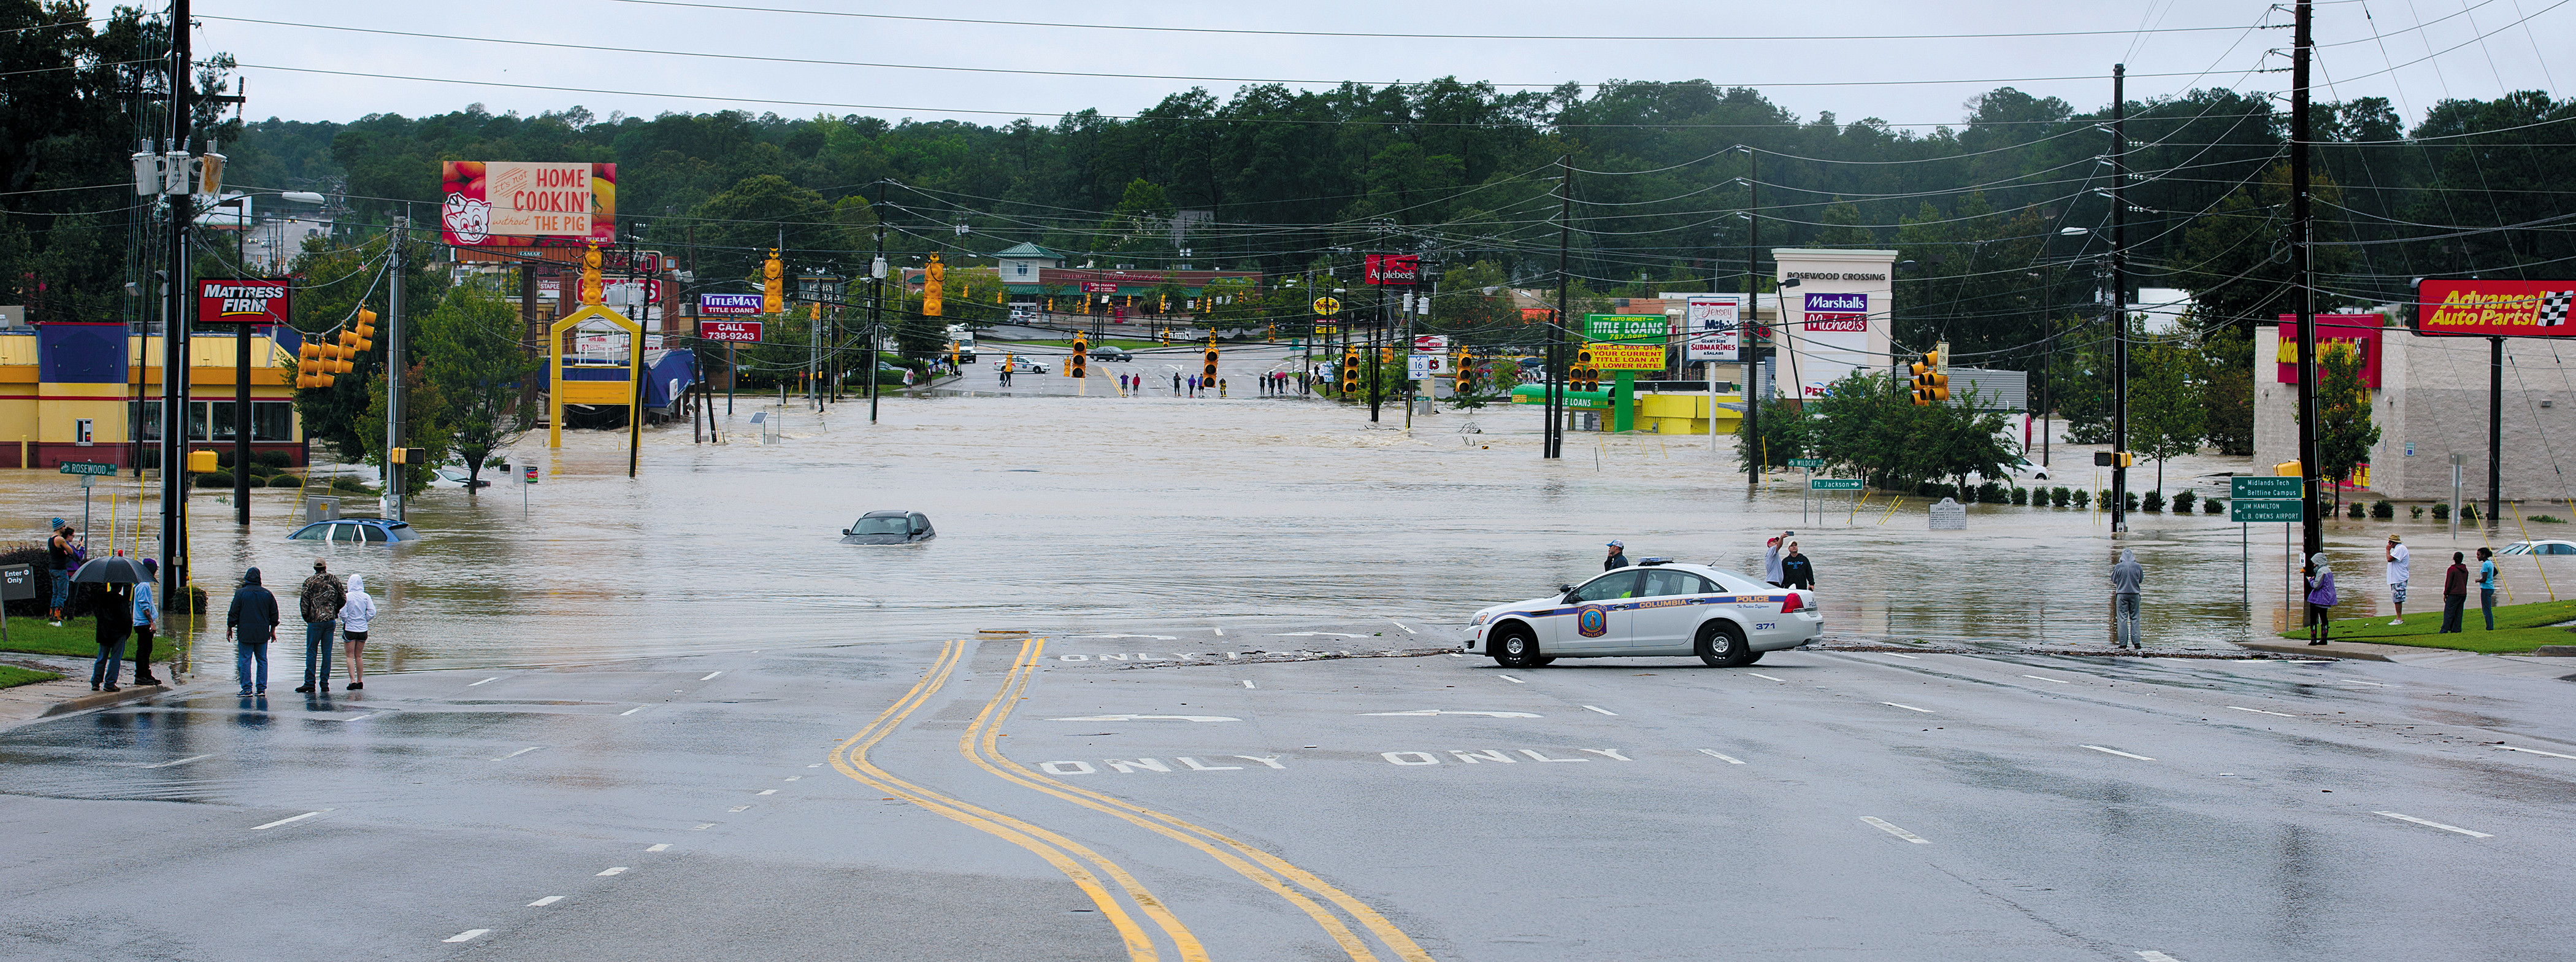
During weather emergencies, officials use GIS to map damage, track responses
and allocate resources. (Columbia flooding in 2015).
GIS is a technology that allows users to analyze and interpret geospatial data to understand patterns and trends. It can also provide real-time tracking of information for a multitude of uses in municipal government. During the response to the June 2015 shootings, a large map updated all the law enforcement agencies at once on security details, such as where officers were staged, where patrol cars were located and which roads were closed, said Tracy McKee, GIS director for the City of Charleston.
"For most Municipal Emergency Operations Center activations, GIS is used," McKee said. "We use it to make sure everyone has a visual and knows what's going on."
GIS was also used after the October 2015 floods, providing a common operating picture for first responders, she said. It was used to keep track of road closures, revealing that at one point there were 50 or 60, McKee said. The GIS division also communicated with hospital employees who were changing shifts during the worst of the storm in order to help them avoid road closures and flooded sections of the city and get safely home from work.
Those maps, put out primarily for hospital employees during the floods, have now evolved into live maps for the public. They are maintained on the city's website where they provide real-time information on road closures due to events like construction and utility work, McKee said.
Tracking damage
After the floods, GIS also played a role in damage assessment, she said. Teams went out to talk to residents and enter data into tablets on the scene. That information came into Municipal Emergency Operations Center in real time.
GIS also is involved in the city's strategy to combat rising sea levels. It can be used to show historical flood patterns that help city officials develop plans for situations such as road closures and evacuations, and to identify city properties that may be impacted.
The City of Myrtle Beach uses GIS as part of its response to weather events, according to Lisa Holzberger, GIS coordinator for the City of Myrtle Beach and past president of the Municipal Technology Association of SC.
Holzberger's department offers an Emergency Operations Center damage reporting app. The mobile and web-based application allows emergency responders and key personnel to assess damage following a hurricane or other natural disasters. A tablet or cell phone can be used to mark damage such as downed trees, power lines, fires or flooding. Data and photos can be uploaded from the device and are immediately accessible on the web mapping application at the EOC. The city's risk manager can also download a data table which can be sent to the Federal Emergency Management Agency, Holzberger said.
The Town of Hilton Head Island also uses mapping for storm preparation and response, according to Jacob Deuel, GIS administrator. The town has a storm surge map that is kept up to date and is provided to the public and to the Emergency Management Division for planning purposes. It shows storm surge levels and elevations across the island.
"We can do scenarios. If a storm surge is 'X,' these structures could be under water," Deuel said.
GIS also works closely with storm recovery efforts by mapping out flood areas as reported by Fire and Rescue, he said.
In the City of Gaffney, GIS Analyst Scott Bollhoefer maintains a full set of FEMA flood plain data, which he uses to create maps to aid city officials in tasks ranging from emergency planning and zoning to code enforcement and road maintenance. He also maintains an extensive set of stormwater GIS data, which spatially locates and provides specifications for key structures such as water flow inlets and outlets, catch basins, pipes, manholes and detention ponds.
"Recent summer rainstorms have stressed the city's stormwater infrastructure, and I've had the opportunity to analyze our GIS data to help our public works crews locate old or damaged structures that are in need of maintenance or replacement," Bollhoefer said. "This will help in preventing localized flooding and in promoting proper discharge of rain water."
Leaves, brush and snow
Gaffney uses GIS for a number of other purposes, including mapping routes and schedules for leaf and brush pickup, inclement weather planning and snow removal. In recent years, Bollhoefer also has used "Collector," a mobile app offered by GIS vendor Esri, to survey and catalogue city streetlights. This app allows him to identify streetlights that are dim or burned out and then share outage information and repair needs with the local utility company.
GIS is growing rapidly, Holzberger said. Esri has a cloud-based solution, ArcGIS Online, that provides countless mapping applications for all city departments, she said.
"Many of our employees are now better able to understand the value of GIS and how it can be leveraged to make them even more efficient in their jobs," Holzberger said. "We will also be exploring 3-D mapping soon. This will be useful for development and design, and it will offer a different kind of visual perspective to enable key decision makers to be better equipped with decision-making tools and analyses."
The city's fire department has also expressed interest in using GIS applications in its day-to-day operations, Holzberger said. Possible uses include a mapping application that could be viewed on a board at each fire station to provide a visual representation of all fire-related calls, which station and unit has responded, and when a situation is under control.
The next generation of GIS experts
Holzberger sees vast learning and growth opportunities in the GIS field. She has spearheaded a successful effort to implement GIS in local public schools. Esri offers a free ArcGIS Online account to any K-12 school in the U.S. Currently, there are 19 schools within Horry and Georgetown counties that use ArcGIS Online, she said. Five of those schools were provided with Esri's ArcMap software through a grant from the Grand Strand Technology Council as part of a pilot program for its Tech After School initiative. The schools will be using the software to create maps and web and mobile applications.
Ten years ago, GIS was mainly used to make maps, Deuel said. Today, paper maps are becoming obsolete as people use mobile devices to work remotely in the field. GIS is now a factor in planning for nearly every department in municipal government.
"As technology has developed, GIS has become a major decision-making tool," he said.